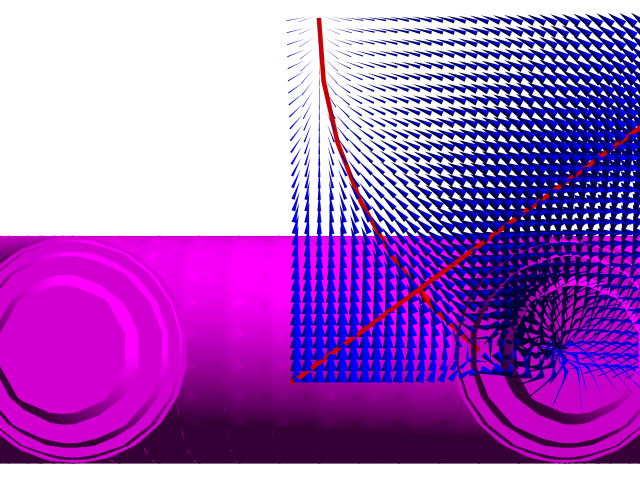
Work in Progress with some actual progress to show.
Size of space modeled in meters:
X=-0.50 to +0.50
Y=-0.70 to +0.70
Z=-0.50 to +0.50
Origin: at the polyhedron’s vertex.
Coil parts modeled are Kiteman’s X-Cusp laid out on a plane i.e. not yet bent around the sphere.
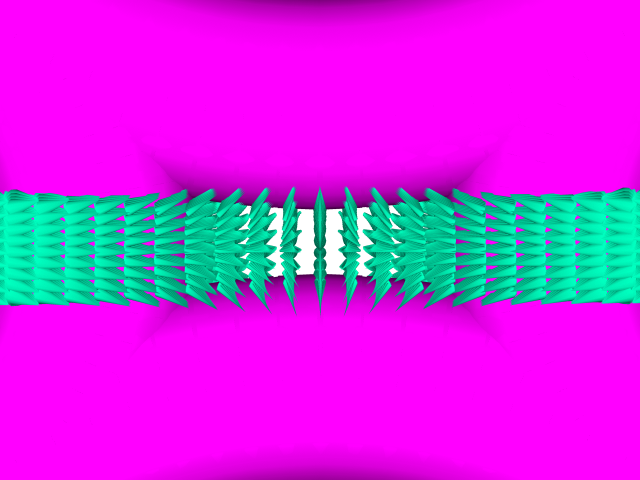
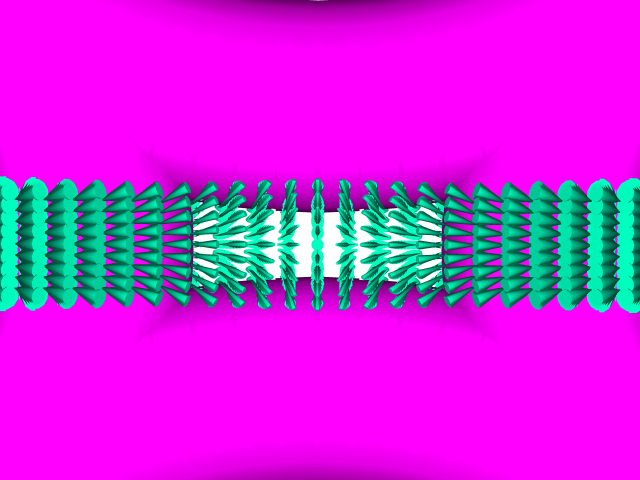
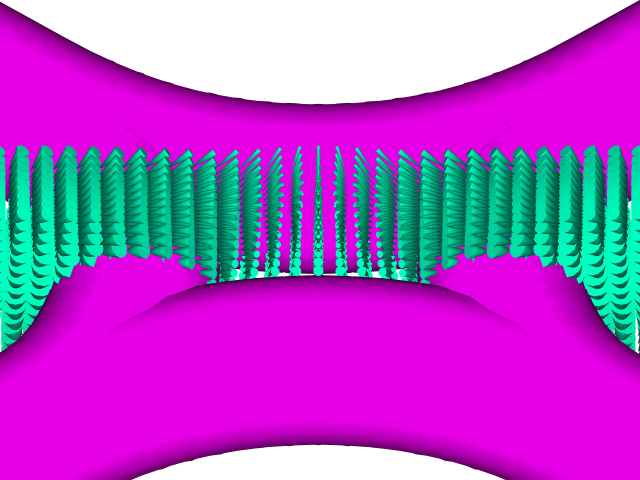
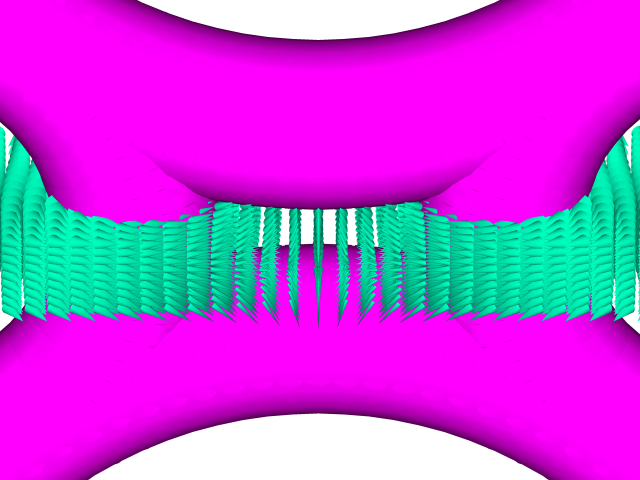
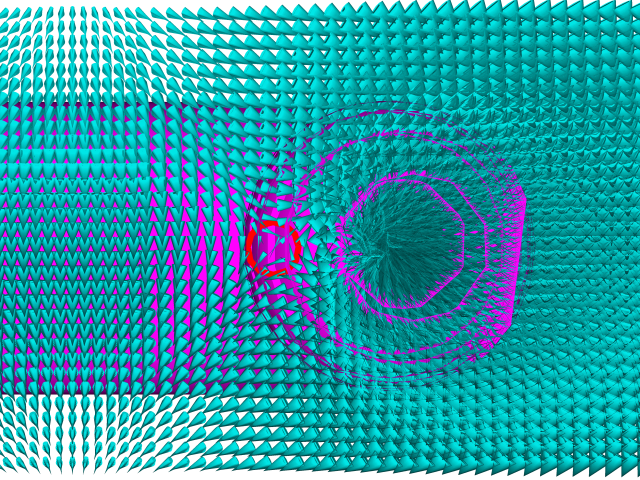
This is using Kiteman’s spreadsheet modified to export the B field at each point in the modeled volume to an AutoCAD script file that then draws simplistic vectors (and conductor casings) in AutoCAD.
Magrid Minor Radius (half thickness) is 0.100 m ~=4” (i.e. coil thickness 8”)
Points modeled: every 0.050 m in each dimension.
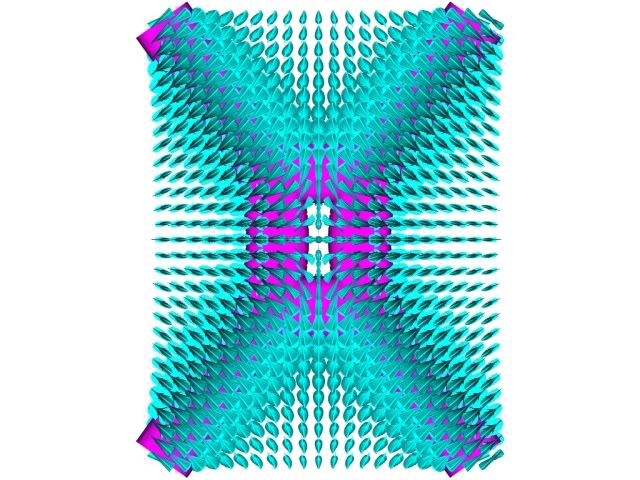
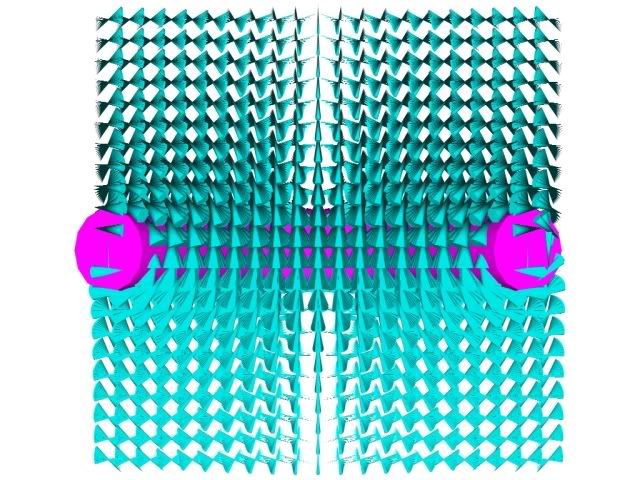
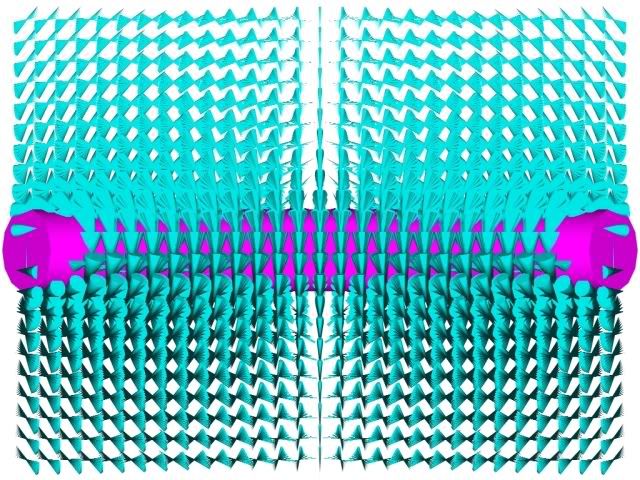
Length of cone: diagonal length of unit volume (i.e. square root of ((0.05^2)*3=0.087 m)
Direction of cone: B field direction
Apex of each cone is the tip of the vector is N (per Biot-Savart I assume North) & the base of the cone is the back of the vector is S.
Diameter of cone base: B field strength in Teslas
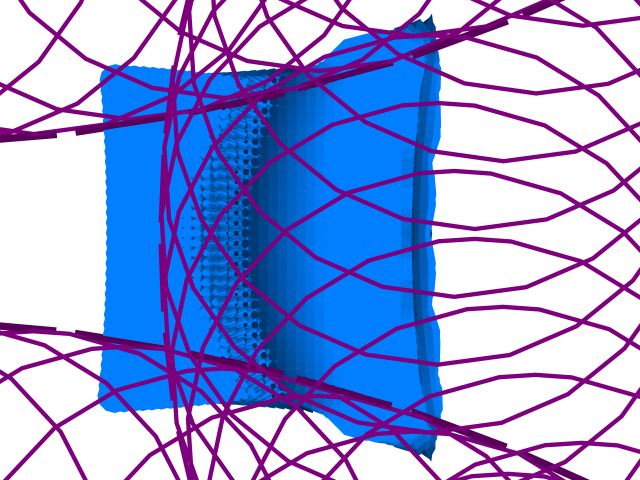
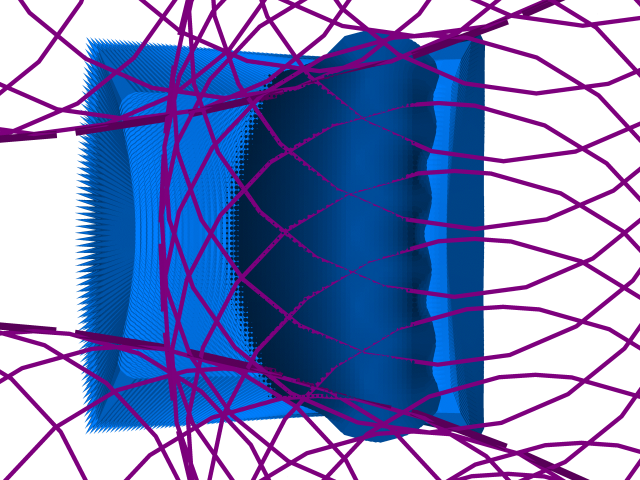
1. It is reduced by an adjustable scaling factor to fill the unit volumes where ever the field exceeds 1 T. This can be easily adjusted.
2. If the plasma heads

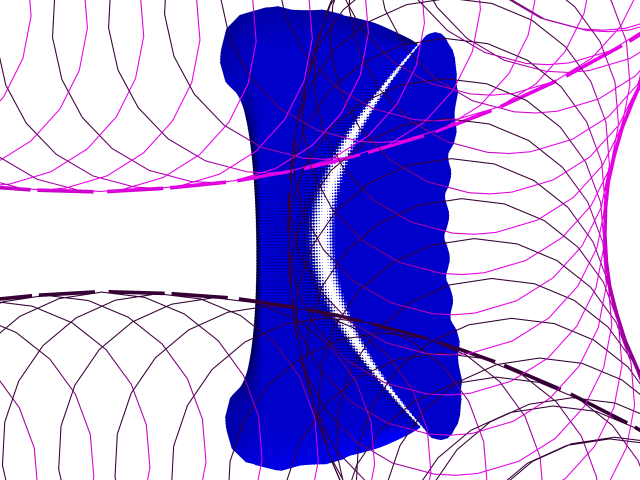
tell me a value for a field strength that contains the plasma at the velocities it has in this region, I will show one at a scale factor that shows the space looking visually plugged wherever the field strength exceeds that number. (Yes, I know it is more complicated than that. It always is.)
Coil current: 5e5 amp turns (I reduced this to open up the space visually so we can see inside the model. This overrides the above scaling factor.)
There are ~12,000 vectors plotted.
This file is 31 meg and slow to move around in.
If we can post the file somewhere, anyone can go to Autodesk and download their free drawing viewer.
Then you all can turn the model every-which-way & zoom to your heart's content.
That will make it much easier to follow what is going on, but it is still confusing.
It should even allow you to use clipping planes, measure parts (to get the actual field numbers at a point from the model) and to print. (It even claims to allow mark-ups, but the one person that I know has used it said no.)
Top:
Front:
Left:
NW Isometric:
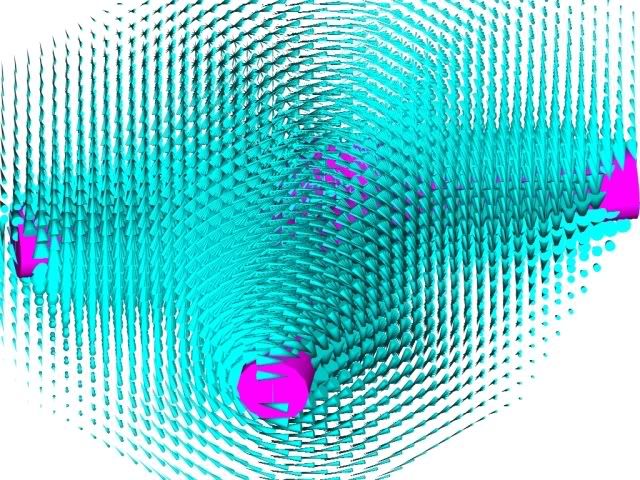
Looking at Wire End:
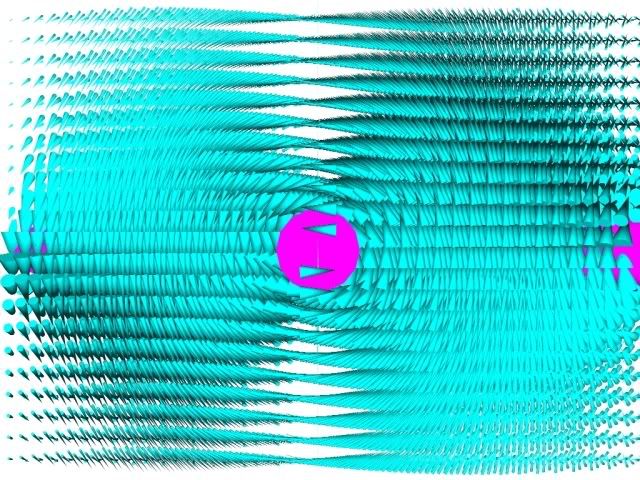
Central detail:
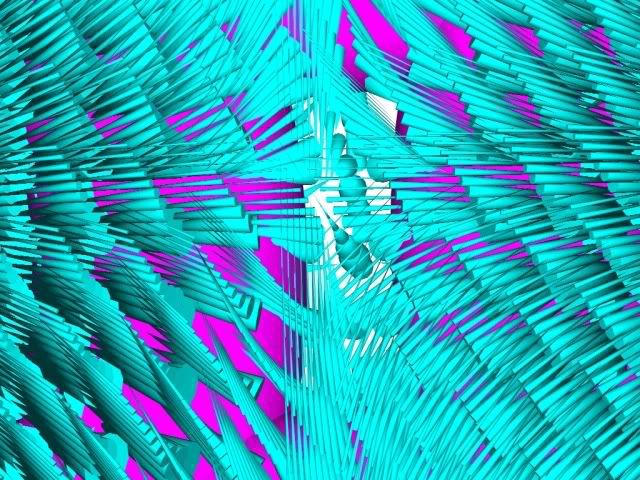
The vectors seem to follow and illuminate the field lines some times. This is when they go through the same relative position in adjacent unit volumes. So, it gives a good general picture of the field lines, but if following a single field line is your thing, caveat.
Notice the vectors buried inside the conductor. Those should not be there. I plan to eliminate those sometime.
Much of the fields are clear when you step back. But, details are hard to see because resolution is coarse (50mm~=2 inches) and because there are so many vectors.
I would really like to see 1mm resolution and be able to see them all clearly. This is an ergonomic/graphics design problem.
And I need to work on finding clipping planes that uncover regions of interest.
Next Tasks:
Model a smaller volume (i.e. just the volume inside of the rectangular opening.)
Finer Grid
More automation of the process
Chase down a few bugs that bother me.
Ergonomics & Graphics design ideas to make showing this density of data more intuitive (I could really use some Help here. If someone can point to some examples of well done presentations of this data density I would really like to see them.)
Different coil configurations
3D coils
Full 6 coil arrangement
Check out the Autodesk free viewer. (if no one else reports in on it first)
Explore the fields.
[Admin may wish to edit some images to be just links after a few days.
But I did so much work on this that I wanted it to show for a while at least.]


